TikTok statistics and analysis for @dgraph

@dgraph
Мой тг: ул.Графская
Второй акк - @cosmosdg
https://clck.ru/3NkKhG
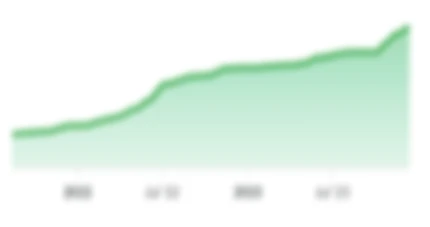
Followers
3.4M
Engagement
1.09%
Selected content
Publication insights
Engagement
Average 1.1%
Higher than 58% of influencers.
Content reactions
Very high 36.9K 60
Higher than 97% of influencers.
Estimated reach
Very high 259K
Higher than 97% of influencers.
Recency
Very recently 3.2 days
More recently than 69% of influencers.
Post per week
Average 2.62
Higher than 70% of influencers.
Audience insights
Followers evolution
Unlock report
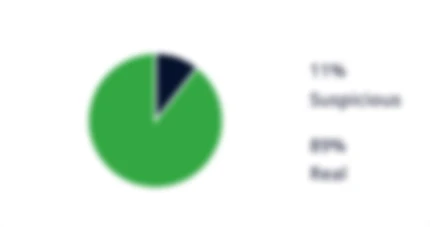
Authenticity
Unlock report
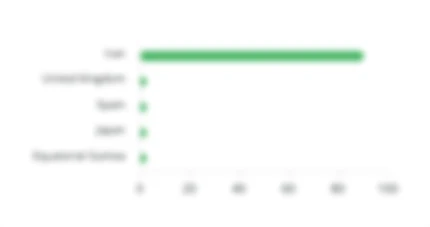
Location
Unlock report
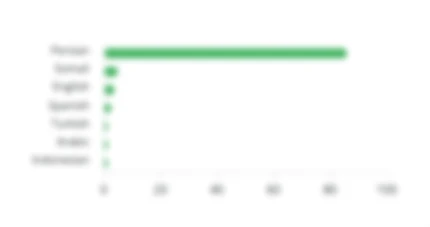
Language
Unlock report
Age
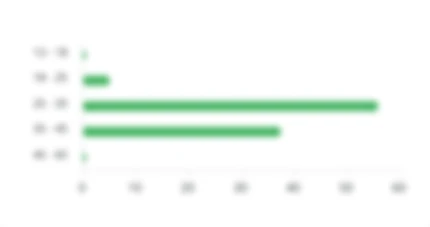
Unlock report
Gender
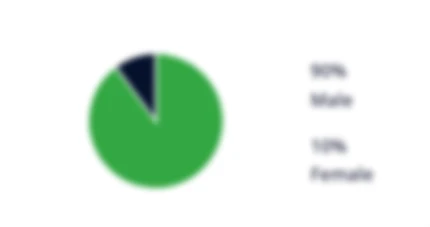
Unlock report
Interests
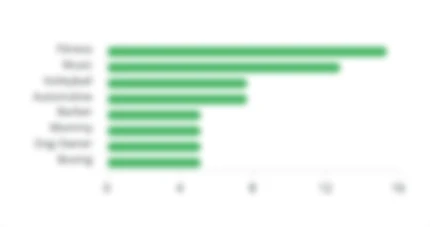
Unlock report
Selected mentions
@nara